 Tony Carnevale
The short answer
Compare the two platforms on your own leads. Count the clicks each one landed, the leads those visits became and the lead rate, then set each beside the rate of your free traffic. Industry averages describe other businesses. On the demo site Meta sent 220 clicks and 9 leads, a 4.1% rate, while the whole site converted at 3.5%.
Key takeaways
- The platform is read from the click id on the landing URL, gclid for Google, fbclid for Meta, msclkid for Microsoft, so the split holds even if nobody tagged a link.
- Set each platform's lead rate beside the rate of your free traffic. A platform that converts below your search visitors is buying you worse visitors than you already get.
- The site has no ad spend in it, so it computes no cost per lead. Divide your own bill by the lead count it shows and the result is built on leads you can open.
- Open the leads. A platform that wins on count and loses on the quality of the people writing to you has not won.
- Judge a month at a time, and change one thing. Lead counts for a small business are tens, not thousands, and a week proves nothing.
Whether Google Ads or Facebook Ads brings a small business more leads is a question your own website can answer. Google reaches people who are searching for what you sell right now. Meta reaches people who were scrolling and had not thought about you yet. Which of those turns into enquiries for your business, at your prices, in your town, is something no article can tell you, and your own leads can.
The method I use with clients is to read that answer off their own site. Three numbers per platform, the free traffic beside them for scale, and then the leads themselves, opened and read. Where I have numbers to show, they are the demo site's, and I say so.
Why averages mislead you
Every comparison article carries an average cost per lead for each platform, drawn from accounts in dozens of industries. A roofer, a dentist and a software company are in that average together. Your number will not be the average, and the only way to find out which side of it you land on is to run the ads and count what came back.
There is a second problem, which is that both platforms report their own conversions under their own rules, so a comparison of Google's conversion column with Meta's is a comparison of two rule books. Your site counts both platforms the same way, which is the whole point of counting there.
Three numbers per platform
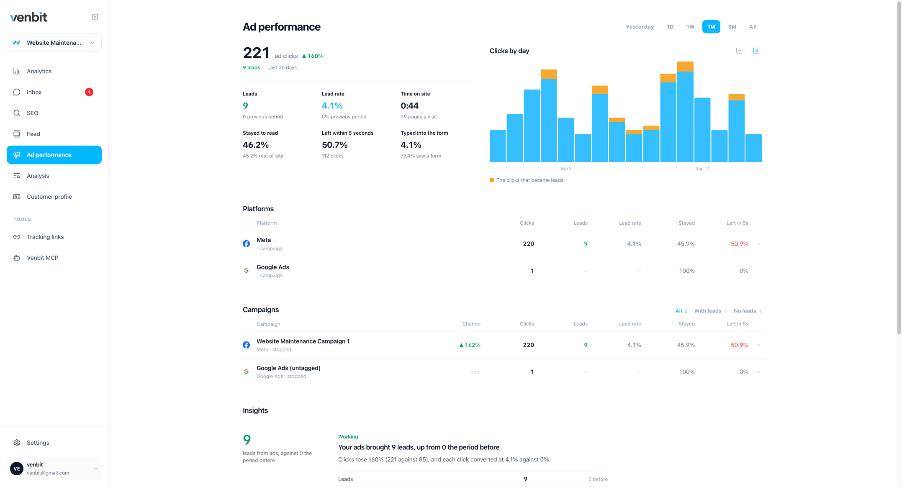
This is the Ad performance tab in Venbit's analytics on our demo site, WebsiteMaintenance.com. Every number read from a screenshot on this page is from that site. In the last 30 days the site took 221 ad clicks and 9 of those visits became leads, a lead rate of 4.1%. The Platforms table under the chart splits that by who sent the click: Meta 220 clicks, 9 leads, 4.1%. Google Ads 1 click, no leads.
Nearly all of the demo site's ad clicks came from Meta in this window, so the Google row is nearly empty and the comparison is lopsided. On your site both rows fill in, and the three columns are what you compare: how many clicks reached the site, how many of those visits sent a form or tapped the phone, and the rate.
The platform is known from the click id each one stamps on the landing URL, gclid for Google, fbclid for Meta, msclkid for Microsoft, so the split holds even if nobody tagged a single link. How that id follows a lead into the inbox is covered on its own page.
Both platforms also hand over the campaign, so the Campaigns table under the platforms splits each platform's clicks further, and on the demo site Website Maintenance Campaign 1 shows 137 visits from Meta with 7 leads and 61 visits from Instagram with 2. Facebook and Instagram are one bill and two audiences, and seeing them apart is how you learn which audience is writing to you.
Clicks here means clicks that loaded your page. The platform bills you for clicks it recorded, and the two counts will differ a little, because some clicks never finish loading and some are bots the site drops before counting.
The row above the table on the demo site reads 50.7% left within 5 seconds and 46.2% stayed to read, which is the quality of the visitors in one line.
Paid leads beside organic leads
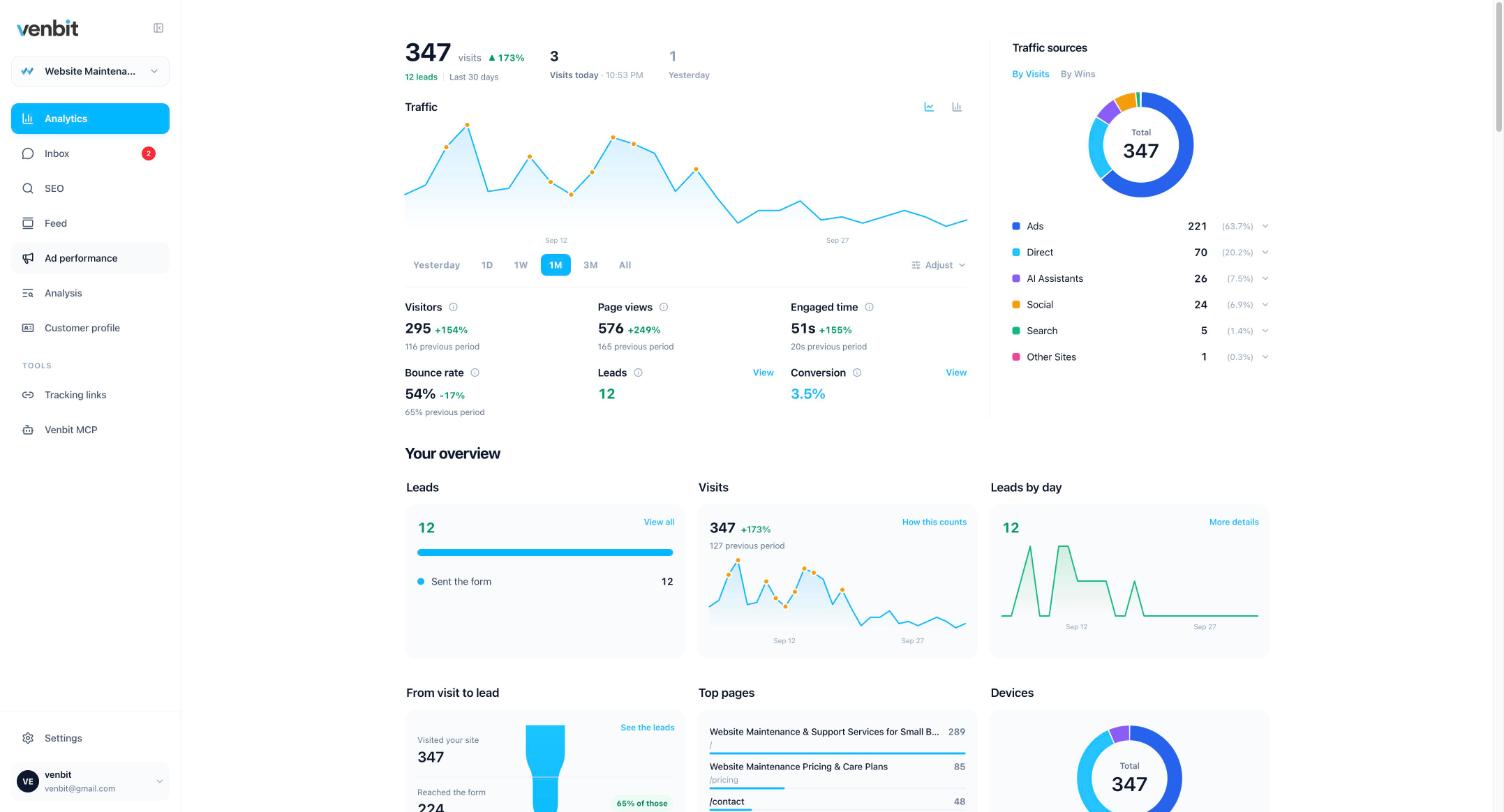
A 4.1% lead rate is good or bad only against something. The dashboard gives you that something. On the demo site the last 30 days show 347 visits and 12 leads, a conversion rate of 3.5% for the whole site, and the sources donut splits the visits: Ads 221, Direct 70, AI Assistants 26, Social 24, Search 5.
Take the ad visits out and the rest of the site is 126 visits and 3 leads, which is about 2.4%. On this site, this month, a paid visitor was more likely to get in touch than a free one. That is a sentence about one site and one month, and it is the sentence you want to be able to write about yours.
One caution on the free side. Direct means the visit arrived with no referrer, which is what a typed address looks like and also what many apps and some QR scans look like, so it is the absence of a source and no evidence of loyal customers coming back on purpose.
Cost per lead for Google and Meta
The site does not know what you spent. There is no ad spend in the data, so it computes no cost per lead and no return on ad spend, and I would rather show you that gap than fill it with an estimate. You have both bills. Divide each by the lead count in its platform row and you have a cost per lead for each platform built on leads you can open and read, which is a better figure than either platform's own cost per conversion, since those divide by conversions counted under the platform's rules.
Then put the two beside the cost of the free traffic, which is whatever you pay for the website and for anyone working on its search ranking. SEO vs Google Ads for a local business works through that trade.
Open the leads before you decide
Counts are where the comparison starts, and they can still fool you. I have watched a platform win on lead count with enquiries that were price shoppers from out of the service area, while the other platform sent fewer, better people. The inbox settles that. Each lead opens to the page it came from, the source, the town, the device and the pages read before writing, and you mark it contacted, won or lost. After a month the won and lost marks, split by platform, are the comparison that matters.
Two things to hold in mind while you read them. A phone tap in the inbox is intent, since the tracker cannot know whether the call connected. And the town on each lead comes from IP geolocation, which is approximate, so a lead from the next suburb over is still a local lead.
The Customer profile tab does the same reading across all your leads at once. On the demo site it says the typical lead is on their phone, clicked an ad, read 4 pages and spent about 5 minutes before getting in touch, with 75% of leads from ads and 58% on mobile. Where your best customers come from goes through that tab, including which towns the valued leads live in.
The demo site's comparison on one table
| Source | Visits that landed | Leads | Lead rate |
|---|---|---|---|
| Meta (Facebook and Instagram) | 220 | 9 | 4.1% |
| Google Ads | 1 | 0 | none yet |
| Everything that arrived free | 126 | 3 | about 2.4% |
| Whole site | 347 | 12 | 3.5% |
Four rows, and the decision for this site this month reads off them without an opinion. Meta is working. Google has one click to its name and cannot be judged, and the free traffic converts a little below the paid. Build the same four rows for your site.
Should I stop Facebook ads?
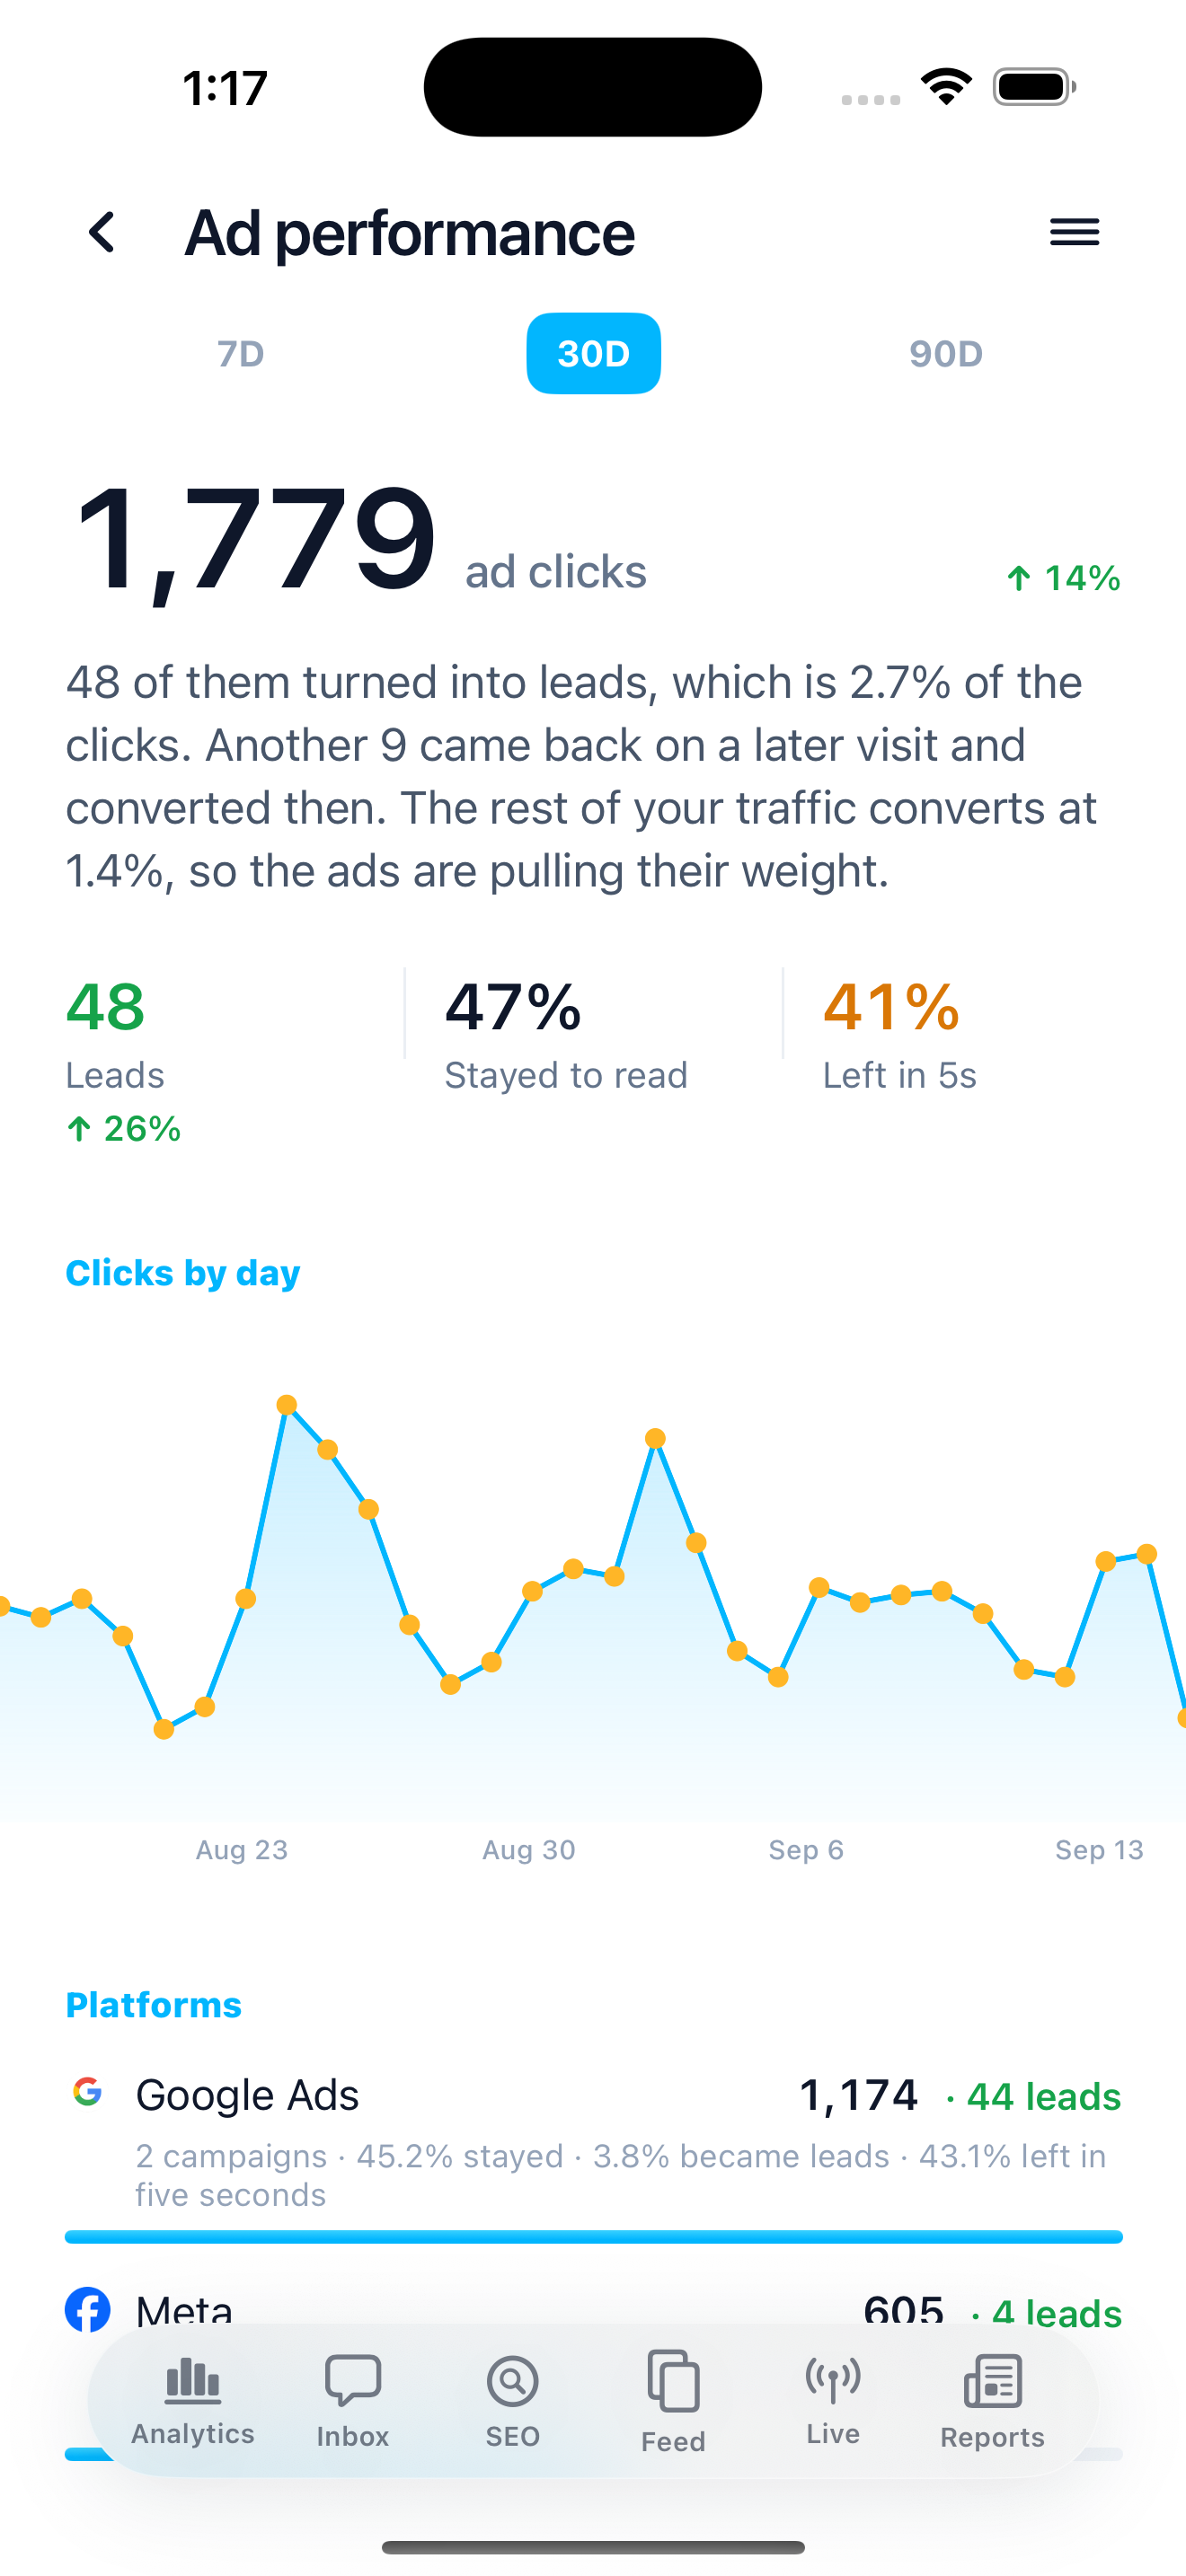
Only if its row says so for more than one month. A small business gets tens of leads a month, not thousands, and a week with two leads instead of five is noise. The Venbit app for iPhone shows the same platform rows with a one-paragraph verdict on top, so the monthly check is a glance.
When you do change something, change one thing. Pause one platform, or move budget from one to the other, and leave the website alone for the month, or you will not know which change moved the number.
And before the next month's budget goes to either platform, make sure the free listings are done. A Google Business Profile that is complete and reviewed sends leads at no cost per click, and the local SEO checklist is the list of what to finish before you spend on ads at all.
Related services
More on reading your website's numbers
Every question in this series, from Website Analytics for Small Business Owners.
Leads inbox4
Ad performance4
- How to Know Which Ad a Lead Came From: gclid, fbclid, msclkid
- Google Ads Conversions Don't Match Analytics: Which Count to Trust
- Google Ads vs Facebook Ads for Small Business Leads: Your Own Numbers (you are here)
- Track QR Code Scans to Leads: Tracking Links for Flyers and Posts
SEO tracking3
Visitor behaviour4
Feed and notifications3
Goals and measurement4

Tony Carnevale
Founder, Venbit
Tony started Venbit in Mill Creek, WA in 2011 and still does the work: web design, SEO, and the website analytics product the company builds and runs for its own clients. The numbers and screens in his articles come from that product, not from a content mill.