 Tony Carnevale
The short answer
Build the profile from leads, not visits. On the demo site, Los Angeles sent the most visits and no leads, while Miami, Dallas and Jacksonville sent the leads. The typical lead was on a phone, clicked an ad, read 4 pages and spent about five minutes before writing. City comes from the IP address and is approximate.
Key takeaways
- Visits by city tell you where your ads pointed. Leads by city tell you where the buyers were.
- The customer profile reads only the visits that became a lead or hit a goal, and shows raw counts beside every share so you can judge the sample.
- City is read from the IP address and is approximate. A lead's typed address, when a form asks for one, is the truth.
- Direct means the visit arrived with no referrer, not that the person came on their own.
- A goal value is a figure you typed times the completions, so any sum you build on it is only as honest as that figure.
- There is no ad spend in the data, so cost per lead by town is a sum you do on paper, not a number the screen shows.
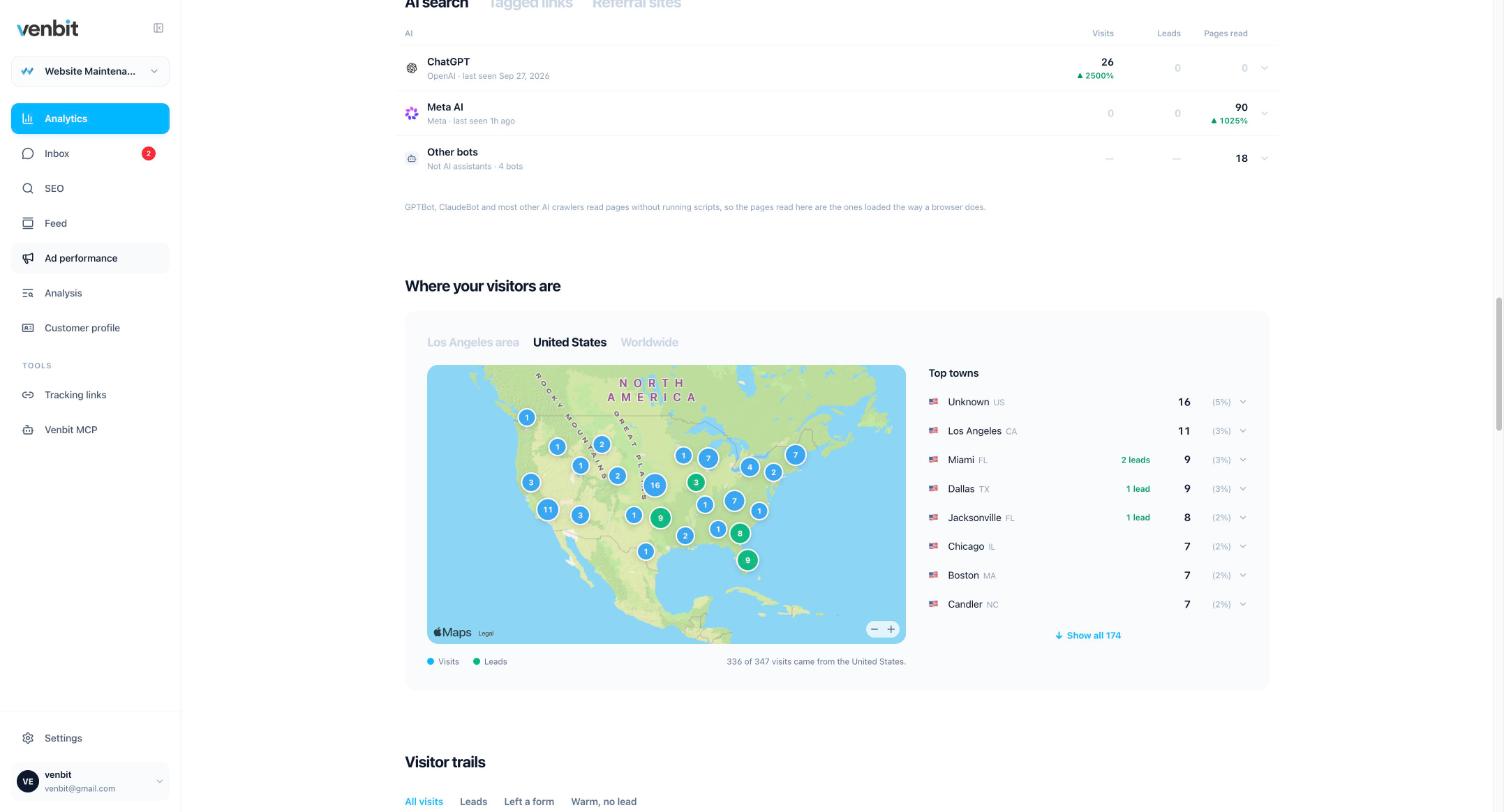
Read the towns your leads came from, not the towns your visits came from, and the two lists will disagree. On the demo site, WebsiteMaintenance.com, the busiest town for visits in the last 30 days was Los Angeles with 11, and it produced no leads. Miami sent 9 visits and 2 leads. Dallas sent 9 and 1, Jacksonville 8 and 1. If that business were choosing where to spend next month on the visit list, it would pick the one town that bought nothing.
That is the whole method. The customer profile in Venbit analytics reads only the visits that became a lead or completed a goal, and says what those people have in common: where they live, how they arrived, how much they read, and how many had been before. Everything else on this page is how to read it without fooling yourself.
Why visits by city lie about where customers are
Visits go where you point them. An ad campaign aimed at a metro area sends visits from that metro area whether or not anyone there needs you, and a ranking for a broad search brings readers from everywhere. A town's rank on the visit list is a fact about your marketing, and its rank on the lead list is a fact about demand.
The demo site makes the gap visible. Los Angeles is the top row in the Top towns list, and there is no lead count beside it. The leads sit in towns further east. Whether those leads came through paid search or through ranking is the next question, and the profile answers that one too.
The customer profile, built from your leads
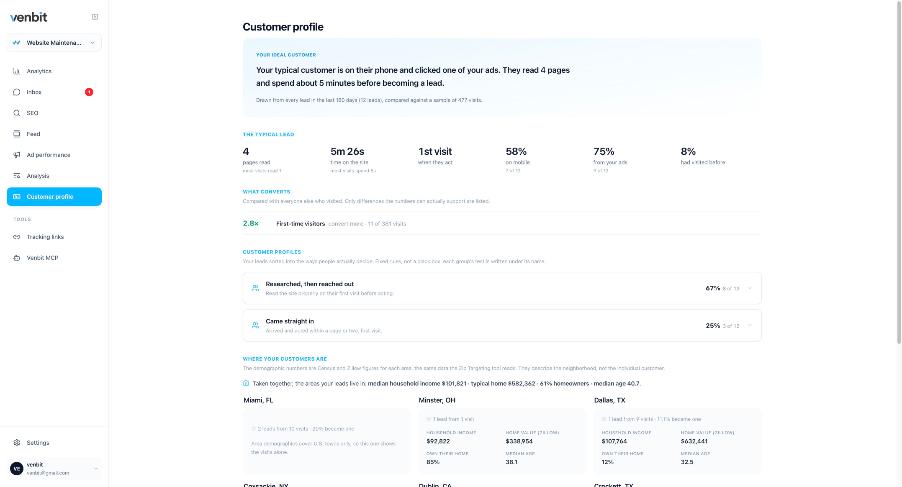
Open the Customer profile tab on the demo site and the first line is a sentence, not a chart. Your typical customer is on their phone and clicked one of your ads. They read 4 pages and spend about 5 minutes before becoming a lead. Under it are the figures that sentence was built from: 4 pages read, 5 minutes 26 seconds, first visit, 58 percent on mobile, 75 percent from your ads, 8 percent had visited before.
Those numbers describe the people who converted and nobody else. A median of the converted visits is a plain count, so it cannot overclaim, and the raw counts sit beside every share so you can see whether 58 percent means 7 of 12 or 70 of 120. On a small business site it is tens of conversions, never thousands, and the tab is written for that. Below a certain number of leads it shows what it has and says it is early.
The profile reads a fixed window, not the date range you picked for the dashboard, because a profile drawn from seven days of leads would be a horoscope. It also makes no attempt to cluster your customers into types with a model. The two profiles it shows on the demo site, Researched then reached out at 67 percent and Came straight in at 25 percent, are fixed rules you can read in one line each.
The one place the tab claims a difference, not a description, is the What converts line. On the demo site it says first-time visitors convert at 2.8 times the rate of everyone else. That claim appears only when the group is big enough for the gap to be real, and stays hidden otherwise. A two-visit fluke cannot top that list.
What a lead's town can and cannot tell you
City comes from the visitor's IP address, which resolves to roughly where their connection meets the internet. For a home connection that is the town, or the one next to it. For a phone on a cellular network it can be a city some distance away. Treat every town on the map as a town-sized guess and never as an address.
The typed answer beats the guess. When your form asks for a town or a postcode, the inbox keeps what the person typed with the lead, and that is the number to trust when the two disagree. On the demo site the lead from Minster, Ohio, typed a domain into the Check any domain field, and that typed value is what the inbox shows, with the town beside it as context.
For towns in the United States, the Where your customers are section adds Census figures for the place itself, so you can see who lives in a town that keeps sending you leads before you decide to go after the town next to it. That is a description of the town, not of your lead, and the two should not be confused.
Source matters as much as town
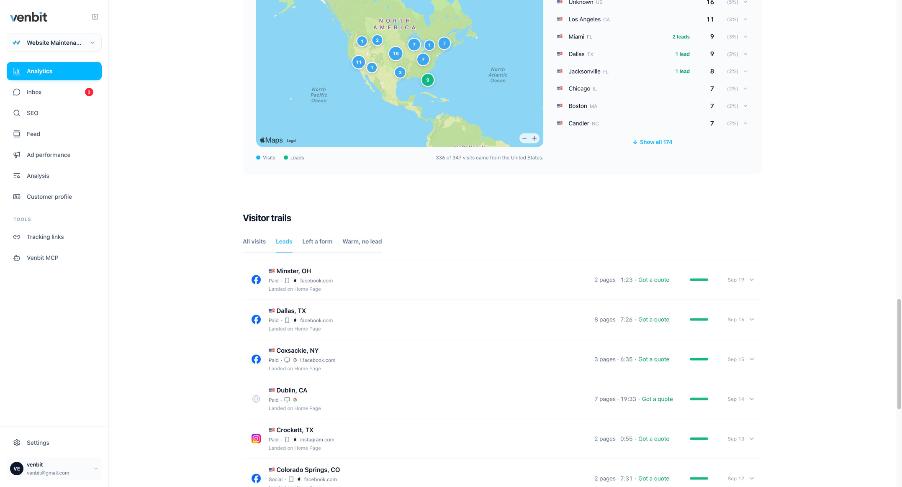
Filter the visitor trails list to Leads and each row carries a town and a channel together. On the demo site: Minster, Ohio, Paid, from facebook.com, 2 pages, 1 minute 23 seconds, Got a quote. Then Dallas, Texas; Coxsackie, New York; Dublin, California; Crockett, Texas, from Instagram; and Colorado Springs, Colorado. Six rows, six towns, and the channel beside each one says what put them there.
A town that only ever sends leads through one ad campaign is a town the campaign found, and it disappears when the campaign stops. One that sends leads through search, direct and ads already knows you, and the two call for different spending, which is the comparison the ads article walks through on the same screens.
One channel label needs reading with care. Direct means the visit arrived with no referrer. A bookmark, a link pasted into a text message and a link in a printed quote all arrive that way, and so does a person who typed your address. Direct is the absence of a source, and a town full of direct leads is a town where something you cannot see is sending people.
Weighing leads by value
Best means something different from most. A town that sends three small jobs is not better than a town that sends one large one, and a form that asks about a service you no longer offer is not a lead at all. That is why what counts as a lead on your site is a decision you make once, by naming the pages, buttons and forms that matter and giving each a value. How to make that decision is its own article.
Be honest with yourself about the value. It is a figure you typed, not revenue the tracker measured. If you set a quote request to the price of an average job, the goal's value is that price times the completions, and a town of tire-kickers will look rich on paper. The profile itself ranks nothing by value; it counts the people who converted. Mark leads won or lost in the inbox as they close, and go back to the value figure when the closed jobs tell you it was wrong.
There is no ad spend in this data, so the screen never shows a cost per lead by town or a return on the money. Those sums need the number from your ads account beside the lead count from here, and they are worth doing on paper for the two or three towns you are deciding between.
Should you target a different area with ads?
Start with the towns whose share of leads is higher than their share of visits. On the demo site that is Miami, with about one visit in forty and one lead in six. A town like that is underfed. More visits from it should mean more leads from it, which is the cheapest growth there is. The towns whose share of visits is far above their share of leads, Los Angeles here, are where the current spend is going to waste.
Then check the channel before you move money. If Miami's leads came from an ad set that already targets Miami, the ad is working and the answer is more of it. If they came from search, the answer is the pages and the listing that earned that ranking, and the local SEO checklist is where that work is laid out, town by town.
Expanding into a new town is the one decision the profile cannot make for you, because a town with no leads has no rows. What it can do is describe the towns that already work, so you pick a new one that looks like them in the Census figures and in the channel that reached them. Then run it for a month and read the leads list again on your phone, where the app shows the same leads with the same towns beside them.
Twelve leads, the demo site's count, is enough to pick a direction and too few to set a budget on, which is why the tab puts the raw count beside every percentage.
Related services
More on reading your website's numbers
Every question in this series, from Website Analytics for Small Business Owners.
Leads inbox4
Ad performance4
SEO tracking3
Visitor behaviour4
Feed and notifications3
Goals and measurement4
- What Counts as a Lead on Your Website? Setting Conversion Goals
- What Is a Good LCP Score, and Whose Phone Measured It?
- How Much of My Website Traffic Is Bots? How to Tell and What to Do
- Where Do My Best Customers Come From? Your Leads by Location (you are here)

Tony Carnevale
Founder, Venbit
Tony started Venbit in Mill Creek, WA in 2011 and still does the work: web design, SEO, and the website analytics product the company builds and runs for its own clients. The numbers and screens in his articles come from that product, not from a content mill.