 Tony Carnevale
The short answer
A good LCP score is 2.5 seconds or less, measured at the 75th percentile of real page loads on your site. Google marks 2.5 to 4 seconds as needs improvement and over 4 seconds as poor. A PageSpeed score is one lab test from one device; the number that matters is what your visitors' phones recorded.
Key takeaways
- LCP is the time until the largest image, video or text block in the first screen has been drawn. The clock stops there, whatever is still loading below.
- The 75th percentile means three in four visitors got that load time or better, and the slow quarter is counted.
- A reading over a minute is a backgrounded tab, not a slow page. Venbit's figure discards it, drops bots first, and shows nothing at all when the period has too few loads.
- Your site is fast for you because you are on wifi, on a laptop, with everything cached. Your customer is on a phone, on cellular, on a first visit.
- Fix images first, then the hero video, fonts and above-the-fold scripts, then hosting. Then read the number monthly.
A good LCP score is 2.5 seconds or less, measured at the 75th percentile of real page loads, with 2.5 to 4 seconds marked needs improvement and anything over 4 seconds poor. Those are Google's thresholds, and the phrase that matters in them is real page loads. The figure in a PageSpeed report is one test from one computer; the figure that decides whether your site feels slow is what your visitors' phones recorded.
I get sent red PageSpeed reports by worried owners a few times a month, and the first question I ask is whose phone measured it.
What Largest Contentful Paint measures
Largest Contentful Paint is the time from the moment a person asks for the page to the moment the largest image, video or block of text in the first screen has been drawn. On most small business sites that element is the hero photo, a background video's first frame, or the headline, and the clock stops when it appears, whatever is still loading further down. It is a reading of when the page looked like a page.
That is why it is the speed number I pay attention to over a total load time. A page can keep loading scripts for ten seconds and feel fine if the photo and the headline were there in one. The reverse, a page that is finished in three seconds but blank for two and a half of them, is what a visitor calls slow.
The thresholds, and what the 75th percentile means
The 75th percentile is simpler than it sounds. Line up every load of the page over the period, fastest first, and walk three quarters of the way down the line. The load standing there is your LCP. Three in four visitors got that experience or better, and one in four got worse. Google chose it so a page is graded on what most people got while the slow quarter still counts, and the slow quarter is where the phones on cellular data live.
It also means an average would lie to you. A tab opened in the background can report a paint time of minutes, because the browser does not report the paint until the person looks at the tab, and a single value like that drags a mean across the room. Google's tools leave background loads out, and a percentile is barely moved by them. If a tool shows you an average load time, ask what it did with the outliers.
PageSpeed score vs real users: whose phone ran the test
A PageSpeed report has two halves, and owners read the wrong one. The score at the top is a lab test: Google loads your page on a simulated device over a throttled connection and times it. It is repeatable and it is one device. Below it, when the page has enough traffic, is field data from Chrome users who loaded the page over the previous 28 days, and that half carries the 75th percentile your grade is based on. A small business site is below the traffic needed for field data more times than not, so the owner sees a lab score and nothing else.
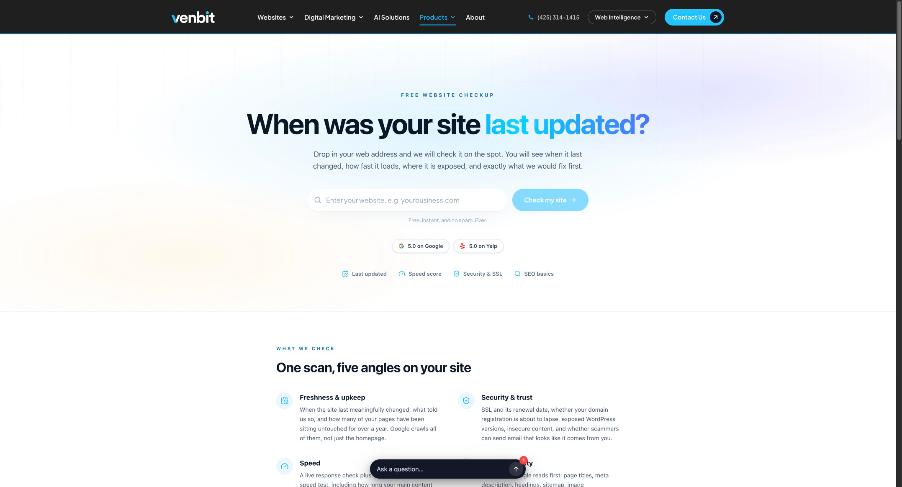
Our free Website Checkup runs Google's PageSpeed test on its mobile setting as one of its checks, and reports the speed score, how long the main content takes to appear on a phone, and what to fix. I built it to give an owner a starting point in a minute, and it has the same limit as any lab test: it is one simulated phone, in one place, once.
Which answers the question I hear most, why the site is slow for customers and fast for me. You are on office wifi, on a laptop, on your fifth visit of the day with every image cached. The customer is on a phone, on a cellular connection in a parking lot, on a first visit, with nothing cached and every script to fetch before your photo arrives. Both of you are telling the truth. Why a site is slow on mobile and fine on desktop has the specific causes.
Your visitors' LCP, from your own site
The field number, measured on your own visitors, is in Venbit's analytics too. Each page load sends one small speed reading with the LCP the visitor's browser recorded, and the site's figure is read at the 75th percentile the way Google grades it, with the median beside it for context. Bots are dropped first, because a crawler's paint time is not an experience anyone had, and a reading over a minute is discarded as a backgrounded tab, not a slow page. If the site has had too few loads in the period there is no figure, which is the right answer.
That number is not a card on the dashboard or a screen in the iPhone app. It is what the site_speed tool answers when you connect Claude to your analytics through the Venbit MCP, and it is the line the ad insights hold a landing page against: when the busiest page your ads land on has twenty or more measured loads and three in four of them took longer than 2.5 seconds, the Ad performance screen says so in a sentence, with the measured seconds and the number of loads beside it.
The reason that check is per page is that a site is not one speed. The home page with the hero video is slow and the service pages are fine, or the blog template loads a share widget that the rest of the site does not. One number for the whole site hides the page that is losing you people, which is why I read the site's figure beside the landing-page sentence on the ad screen, and why the Website Checkup tests the one page you give it.
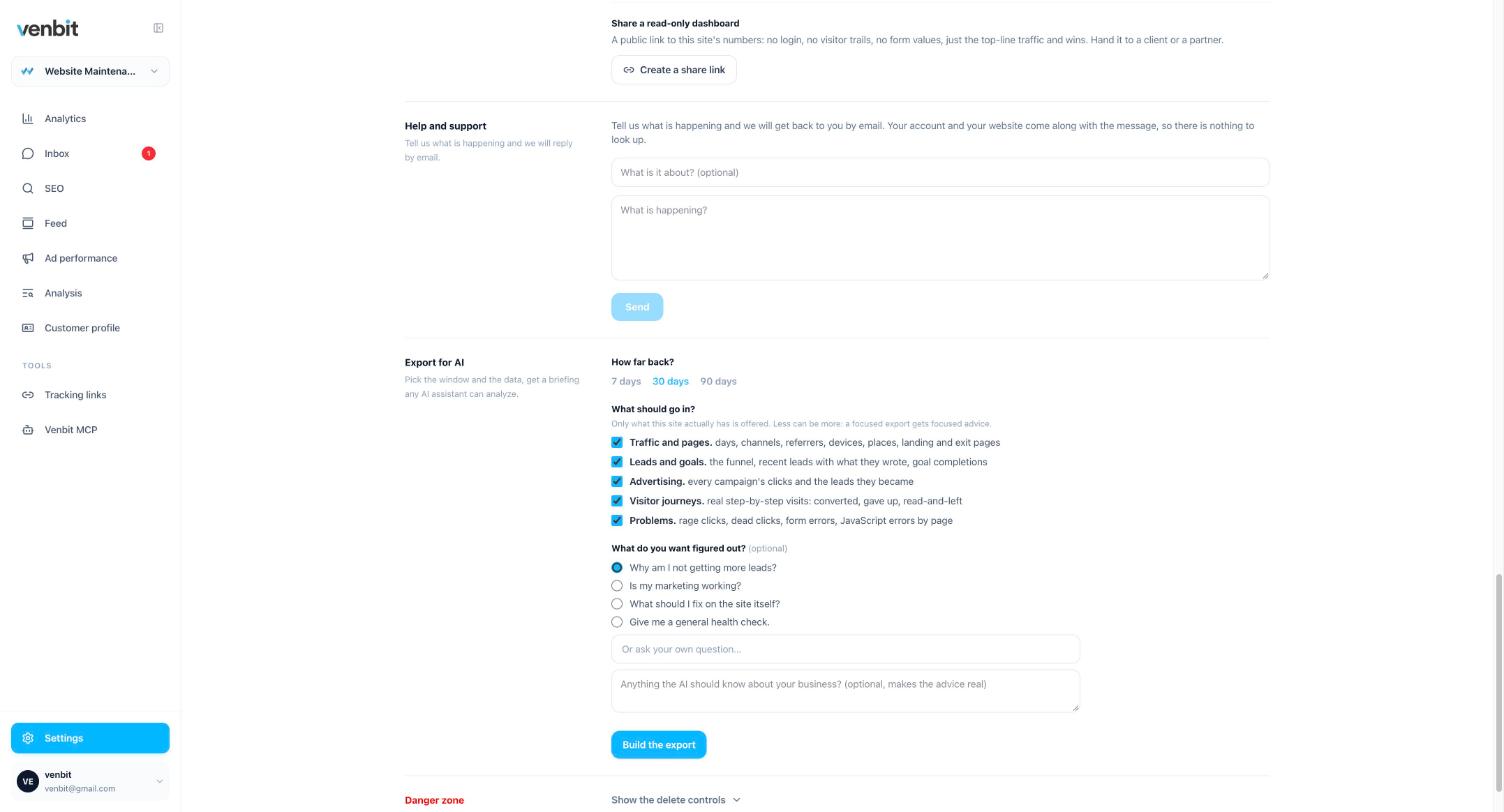
With a red report in hand, the place I would start is the Export for AI in Settings. Tick Problems, which adds rage clicks, dead clicks, form errors and JavaScript errors by page, choose What should I fix on the site itself?, and hand the export to the assistant you already use. It is the site's own figures, written out so an assistant can read them, which is a better starting point than a lab score and a hunch.
Does page speed affect leads
I am not going to quote a study here, because the ones in circulation were measured on retail sites with millions of sessions, and your site is not one of those. What I can tell you is what a slow page looks like in the data of a small business site. Visits that land and leave before the first scroll. A rage click on a button that has not become a button yet, because the script that makes it work is still downloading. A form that people start on the page and abandon, because the field they tapped jumped when an image above it finally loaded.
Those are visible as trails and as frustration signals, and they are the link between a speed number and the phone not ringing. I wrote up what a rage click is and what it says about a page, and a page with a poor LCP and rage clicks on its first screen is the clearest fix-first case I know.
What to fix first
In the order I find them on small business sites.
- A hero photo uploaded straight from a phone at several megabytes is the single most common cause of a poor LCP, and sizing it for the web fixes the grade on its own more times than anything else on this list.
- A background video in the first screen makes the browser fetch enough of it to draw a frame, and on cellular data that frame is your LCP.
- A page that waits for a web font before it draws the headline is blank until the font arrives. Let the system font show first.
- Chat widgets, ad pixels and page builder scripts that load before the content does belong after it.
- A shared server that takes a second and a half to answer at all cannot produce a 2.5 second LCP whatever the page does.
How to make a website load faster walks through each of those with the tools and the sizes to aim for.
Then put the number on a monthly rhythm instead of a daily one. LCP moves when the site changes, a new plugin, a new hero image, a hosting migration, and between those changes a daily reading tells you nothing new. I keep it off the daily list, with the rest of what to check and when, and I look at it the week after anything on the site is touched.
Related services
More on reading your website's numbers
Every question in this series, from Website Analytics for Small Business Owners.
Leads inbox4
Ad performance4
SEO tracking3
Visitor behaviour4
Feed and notifications3
Goals and measurement4
- What Counts as a Lead on Your Website? Setting Conversion Goals
- What Is a Good LCP Score, and Whose Phone Measured It? (you are here)
- How Much of My Website Traffic Is Bots? How to Tell and What to Do
- Where Do My Best Customers Come From? Your Leads by Location

Tony Carnevale
Founder, Venbit
Tony started Venbit in Mill Creek, WA in 2011 and still does the work: web design, SEO, and the website analytics product the company builds and runs for its own clients. The numbers and screens in his articles come from that product, not from a content mill.
Sources
- web.dev, Largest Contentful Paint (LCP)
- Google for Developers, About PageSpeed Insights
- Google Search Central, Understanding page experience in Google Search results
- Venbit MCP, the site_speed tool: p75 Largest Contentful Paint with the median, readings over one minute discarded