 Tony Carnevale
The short answer
Your most visited pages are the Top pages list on the dashboard, with the count beside each. Divide page views by visits for pages per visit; on the demo site, 576 views over 347 visits is a little under two. The customer profile shows how many pages a lead reads before contacting you; on the demo site, 4.
Key takeaways
- On the sites I look after the home page is first by a distance, and second place is the page that tells you what the site is being found for.
- Visitors and visits are different counts. The demo site had 295 visitors and 347 visits, so about fifty of those visits were people coming back.
- Two thirds of the demo site's leads researched before reaching out and a quarter came straight in, and the raw counts sit beside every share.
- A page view counts a page that loaded; a page the browser pre-loaded and the person never opened does not count.
- Time on a page counts only while the tab was visible and focused, so a tab left open in the background does not inflate it.
- Open one page to see where visitors came from, where they went next, how far they scrolled, and how many left from it.
The pages people read on your website are listed on the dashboard as Top pages, most viewed first, with the count beside each one. That answers the first question. The second question, how many pages a visitor reads, is page views divided by visits, and the third, how many pages someone reads before becoming a lead, has its own tab, because leads read differently from everyone else.
Every number on the screens below is from the demo site, WebsiteMaintenance.com, over its last 30 days: 347 visits, 576 page views, 12 leads.
The most visited pages
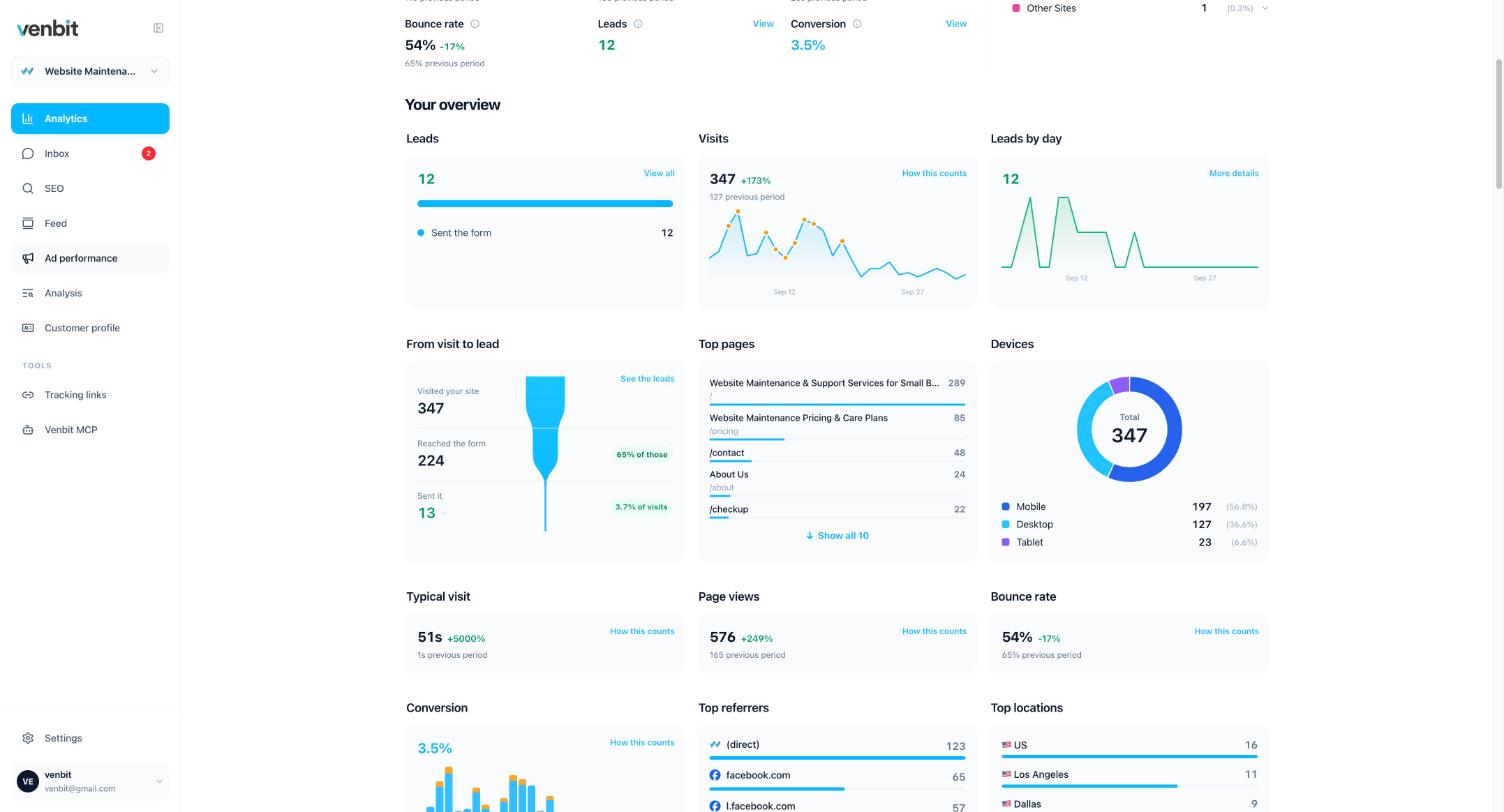
Top pages is a count of page views per page, bots removed before counting. A page view is every page load, including moving between pages on a single-page site, and back and forward navigation counts. What does not count is a page the browser pre-loaded in the background that the person never opened. So the list is pages people saw, in the order of how many times they were seen.
On the small business sites I look after, the home page is first by a distance, and the second place is the one that tells you something. A contact page there means people arrive ready to talk; a service page there says what the site is being found for, whatever you believe the business is; and an old blog post in second place means Google is sending people to that post and the rest of the site is not catching them.
How many pages a visitor reads
Divide page views by visits. The demo dashboard shows 576 page views across 347 visits, which is a little under two pages per visit. That is the shape I see on most local business sites. People arrive, read one or two pages, and contact you or leave.
Visitors and visits are different counts, and the gap between them is worth a glance while you are on this screen. The demo site had 295 visitors and 347 visits in the period, so about fifty of those visits were people coming back. A visit ends after 30 minutes of inactivity, the same window Google Analytics uses, and a returning person is recognised by a random identifier in their browser, not by a cookie and not by a fingerprint. Pages per visit divides by visits, so a person who came three times and read two pages each time counts as three visits of two pages.
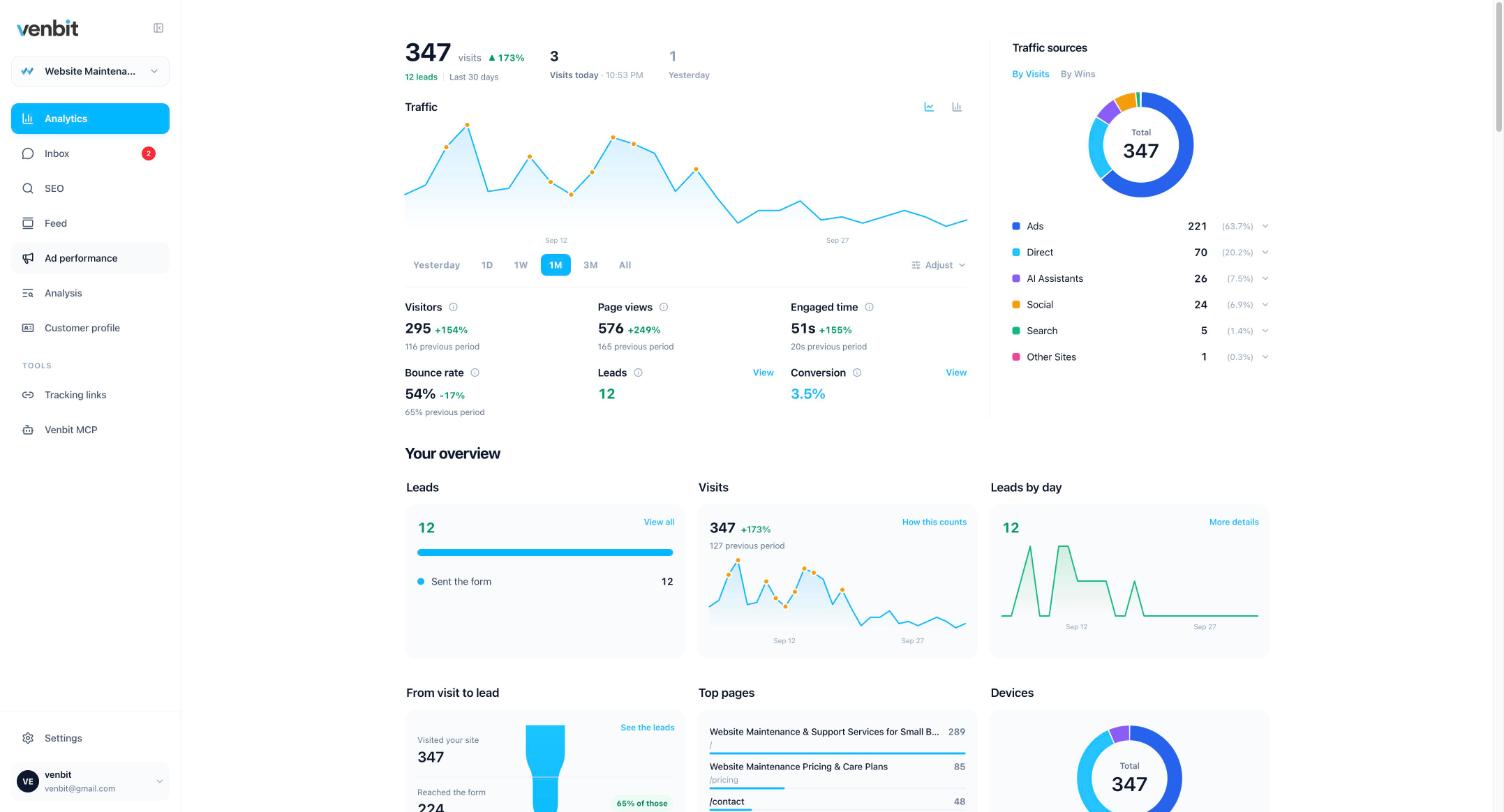
Two numbers on that screen keep pages per visit honest. Engaged time is 51 seconds, and it counts only while the tab was visible and focused, so a phone put down with the page open adds nothing. Bounce rate is 54%, and here a bounce is a visit that saw one page, stayed under ten seconds and did nothing, no scroll and no click. A person who reads one long page for two minutes is not a bounce, and one page read properly is a page that got read.
How many pages a lead reads
Leads read more. The Customer profile tab reads only the visits that became a lead and says what they had in common, and on the demo site the sentence at the top is: your typical customer is on their phone and clicked one of your ads; they read 4 pages and spend about 5 minutes before becoming a lead.
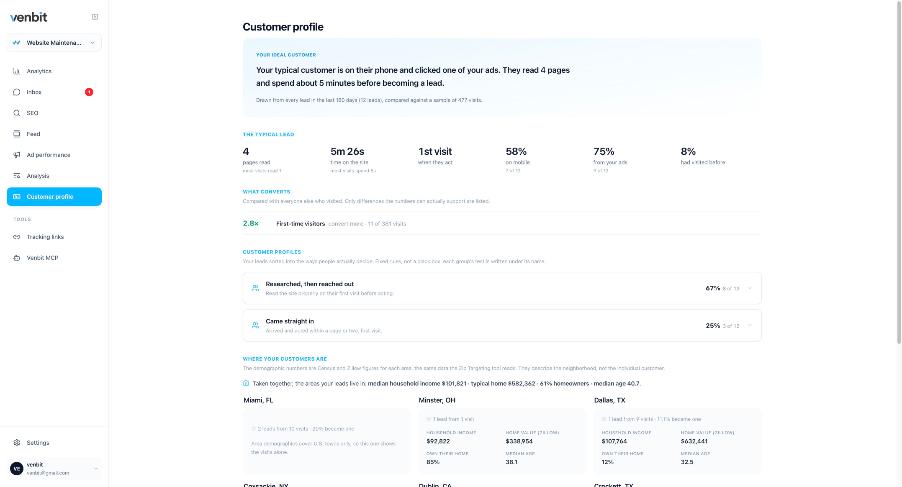
Set that beside the site-wide figure. Visitors average a little under two pages; the typical lead read 4 and stayed 5 minutes 26 seconds. Two thirds of the demo site's leads fall in the profile called Researched then reached out, and a quarter Came straight in. Those are medians and shares of the converted visits, with the raw counts shown beside every share, because a site with tens of leads cannot support fancier statistics without lying.
This is the number to design the site around. If leads read four pages, the site needs four pages worth reading in a row, and each one needs the next step on it. Writing pages that carry a reader to the form is the craft; the profile tells you how long the chain has to be.
One page on its own
The top pages list says which pages are busy. It does not say whether a page is any good, and that is the question you have the moment you see one on the list, which is what people did after they arrived. Open a page in Venbit's website analytics and it answers from the visits already recorded: how many visits included it, how long people stayed, how far down they scrolled on average, how many visits started on it and how many ended on it, how many of the people who landed there read nothing else, the forms sent and numbers tapped on it, and where people went next.
Read the exits first. A page that ends a lot of visits is either the natural last page, your thank-you page or your contact page, or it is where people decide against you. Heavy exits with shallow scrolls on a service page mean it lost them near the top; the same page with deep scrolls and heavy exits was read to the bottom and offered no next step. The pages visitors move to next tell you which links on the page are doing the work.
Pages one person read, in order
The averages describe the site; the trail describes one visit. Every row in Visitor trails is one person, with the number of pages and the time on site, and opening it lists each page in the order it was read, how long it was open and how far they scrolled. On the demo site, one lead's trail reads: home page open 36 seconds, the quote form started and sent, then the Free Website Checkup page open 52 seconds and scrolled halfway. Reading a visit step by step is the companion to this article.
In the Venbit app for iPhone the Live screen shows the same thing as it happens: who is on the site right now, the page each person is on and the last thing they did on it, with the people active in the last five minutes listed newest first.
Pages that bots read
AI crawlers read your pages too, and they do not count here. On the demo site the AI search section shows Meta AI reading 90 pages and other bots reading 18, kept apart from the 26 visits that ChatGPT sent as people. Those crawler reads are how an assistant learns what your business does, and they are worth knowing about, but they stay out of Top pages, out of page views and out of pages per visit, because a crawler reading your pricing page is not a customer reading it.
What to do with the list
Take the top five pages and open each one on your phone, because that is where they get read. The devices donut on the demo site's overview puts 197 of 347 visits on mobile, 127 on desktop and 23 on a tablet, and the customer profile says 58% of leads were on a phone. For each page, find the next step: the form, the number, the link to the service. A page in the top five with no next step is a dead end that your busiest traffic is walking into, and fixing it is a one-hour job. What a good small business website has on every page is the checklist for that hour.
Then compare the top five with the pages your leads read. When the pages visitors read most and the pages leads read before converting are the same pages, the site is working as a path. If they differ, the busy pages are entertaining people and the quiet pages are converting them, so the quiet pages need to be one click from the busy ones. That gap is the most common shape of traffic without leads.
Related services
More on reading your website's numbers
Every question in this series, from Website Analytics for Small Business Owners.
Leads inbox4
Ad performance4
SEO tracking3
Visitor behaviour4
- What Is a Rage Click? The Definition and Why It Costs You Leads
- How to See What Visitors Do on Your Website, Step by Step
- Which Pages on My Website Get Read? Your Most Visited Pages, Counted (you are here)
- Why Do People Abandon My Contact Form? How to Find the Field
Feed and notifications3
Goals and measurement4

Tony Carnevale
Founder, Venbit
Tony started Venbit in Mill Creek, WA in 2011 and still does the work: web design, SEO, and the website analytics product the company builds and runs for its own clients. The numbers and screens in his articles come from that product, not from a content mill.